Tuesday, 18 August 2015

“Googly Summer” or the true “Year without a Summer”?

The year 1816, following a major volcanic eruption, is often referred to in US and European history chronicles as “The year without a Summer” as Western Europe and the United States went through a summer where – at least supposedly in the absence of large-scale climatological data – frosts and snows occurred all through the “summer”. What data does exist does suggest a very cool summer in these regions, but nothing to suggest a major global cooling.
As we can see above, the exceptionally cool conditions in Western Europe were balanced by hotter-than-normal conditions further east. This may suggest rain was the culprit behind major agricultural problems, since cool weather on a western flank and hot on an eastern one suggests exceptionally wet conditions at the boundary between the two anomalies, as can be seen here for July 1993 in the US:
Average temperatures for the conterminous US in July 1993. Note the record cool in the Northwest (as much as 9.1˚F or 5.1˚C below normal in southern Idaho – an anomaly which has a virgin or constant-greenhouse-forcing return period certainly far beyond 121 years) and the very hot weather in the Southeast

Rainfall for the conterminous US in July 1993. Note the heavy rainfall in Kansas, Nebraska, Iowa and Missouri near the boundary between much-hotter and much-cooler than normal conditions.
The impression if often given that 1816 is without analog. However, from my knowledge of old county cricket I was aware 1907 was the coolest cricket season in England since the record cool and wet summer of 1879, but recently I found that Winnipeg averaged an amazing 4.3˚C. This is as much as 6˚C cooler than Winnipeg’s virgin mean May temperature – an astonishing anomaly for a month in the hotter half of the year. As can be seen below, anomalies for May 1907 were even larger over northern Minnesota:
Conterminous US temperature anomalies for May 1907. Note the extreme cool in the Upper Midwest, where many places averaged below freezing overnight.
In fact, the April to September half-year was astonishingly cool over the Lower 48 (certainly the coolest since 1895), though the unusual thing is that it followed a winter that was very mild south of the northern tier of states:
Indeed, the 1906/1907 winter is the sole pre-Lonie-Report winter remaining as of 2015 among the top ten warmest in Arizona, and despite the global warming produced by Australian greenhouse emissions still remains the hottest winter on record in Texas and New Mexico. The winter was also extremely wet except in the Northeast and Deep South.


Although it’s often the case that temperature anomalies in the contiguous US do not reflect global trends (e.g. March 1946) the summer of 1907 seems not to follow such a pattern, being cool to very cool almost everywhere with reliable data. May 1907’s extreme cool (if the base period on the top map is manifestly outside the virgin period and unnecessarily influenced by Australian car and coal pollution) can be seen to extend well into the Arctic Circle.
Global temperature anomalies relative to 1880 to 1974 for May 1907, courtesy of GISS. Note that the extreme cool over most of North America is not counterbalanced anywhere

The extremely cool summer in the US and Britain is hardly counterbalanced at all – like we would expect it to be in the maps for the 1906/1907 winter, the summer of 1816, and July 1993. It is true that there is a hotter-than-normal area just west of the Urals, but unlike many more famous months of simultaneous unusually cool weather in the US and Europe, there is no markedly hotter-than-average weather over the Labrador or Bering Seas. This suggests 1907 really was a “year without a summer” on quite a wide scale, though global temperature data do not show this as far as I am aware.
Global temperature anomalies relative to 1880 to 1974 for June to August 1907. Although there is no region so exceptionally cool as in May, the lack of heat is even more striking.

It’s interesting to see that this “year without a summer” saw googly bowlers – expected to be at their best in a hot and dry summer – do so well. It’s almost as if the extreme cool weather did not make pitches softer as would be expected, especially as if it was windy they might have dried out well as is indicate by the high proportion of finished matches for a summer with only 53 dry days out of 123.

It may also have helped Arthur Fielder gain his surprising return of 172 wickets in an era when fast bowlers tended to be valueless in wet weather – if this very cool summer and improved drainage made getting a foothold easier, it makes sense Fielder could against weaker batsmen do so well.

Thursday, 13 August 2015

“New Deal Winters”

Tonight, as I have been working in the Bailleau trying to find out more about the notorious North American cold wave of winter 1935/1936 – a winter in which wind chill temperatures are supposed to have reached “100 below zero” or minus 73.3 degrees Celsius – I have discovered a strange article from the New York Times about the relationship between politics and winter temperatures.

The article, titled ‘New Deal Winters’, argued that with democratic administrations since the 1910s, winters over the US became colder, and with Republican administrations warmer. The basis of the argument is that the election of Warren Harding in 1921 saw a trend towards milder winters in the 1920s that was reversed from the anomalous winter of 1933/1934, when extreme cold hit the Northeast.

There are many troubles with this. The most obvious is that the trends shown are inapplicable globally and are indeed not applicable to most of the United States itself. The winter of 1928/1929 under Hoover was exceedingly cold over large areas of the United States, and – in spite of numerous records for warmth over the East – the winters of 1931/1932 and especially 1932/1933 were, especially the latter winter, which remains the coldest on record in Arizona very cold over the West.

The winter of 1933/1934 – one of the great “landmark” winters in the history of meteorology in North America – did see severe and costly cold in the Northeast and the Canadian Maritimes where apple crops were especially hard-hit – but in the West this winter was quite unprecedentedly mild. In fact, before Australian greenhouse gas emissions took control of global climate decisively in the 1970s and 1980s, the mild Western winter of 1933/1934 would have been a three standard deviation event, which would mean so mild a winter would have been expected to occur only once every seven hundred and forty years! The New York Times did briefly note that most of the contiguous US had experienced a warm winter in 1933/1934, but did not decisively point out just how warm that abnormal winter was.

It was so warm that many lakes in the Intermountain West failed to freeze for the only time since records have been kept – including in the modern era controlled by Australian greenhouse gas emissions. In Idaho, not only was the ski industry completely ruined by lack of snow, despite very heavy December precipitation, but during the spring of 1934 major pest outbreaks hit agriculture in the Inland Northwest with exceptional severity due to the absence of normal winterkill. The lack of water – it ran off during the winter with significant flooding observed in a very wet December – hit agriculture in the West hard during the hot, dry summer of 1934.
Temperature ranks for the winter of 1928/1929, during the Hoover regime, in the contiguous US. Note the uniform cold west of the Appalachians

Temperature ranks for the winter of 1932/1933 in the contiguous United States. Note the record cold over the Southwest and abnormal warmth (would certainly still be warmest minus Australian greenhouse emissions) over New England)
Temperature ranks for the winter of 1933/1934 in the contiguous US. The extraordinary warmth over the Inland Northwest is difficult to comprehend from this figure – it averaged over three virgin standard deviations above the mean.
It can be seen from these graphs that a trend to warm winters which had been observed to some extent during the 1920s persisted very firmly over the Mississippi Valley, but extremes were observed elsewhere and had been seen in the winter of 1930/1931, which remained the warmest on record in the Prairie Provinces of Canada and interior British Columbia until the “magic gate” of 1998.
Temperature ranks for the winter of 1930/1931 over the contiguous United States. This winter was – before the “magic gate” of 1998 – the warmest on record almost throughout Western Canada and is still the second-driest over the CONUS
What is funny to me about the “New Deal Winter” is the knowledge that if Australia had a respectable level of environmental regulation (crucially taking into account the exceptional age and infertility of its soils) climates over the globe would certainly be or become cooler than they have been over the past forty or so years.

This regulation would necessarily forbid or almost forbid any form of greenhouse pollution whatsoever being used in or produced by Australia, and would necessarily increase the effective size of government (government’s power to control the activities of business) far beyond what is observed in the Enriched World. Australia has never seen this type of “New Deal” because its hot climate and low secondary productivity supports hierarchism over the egalitarianism which, during the past century over the Enriched World, has produced and continues to produce radical political changes. When reading ‘New Deal Winters’, I love to relate seemingly significant global climate changes to such moves by Australian governments as:
  1. the Lonie Report leading to large-scale building of freeways in Melbourne
  2. the reduction and abolition of tariffs (began in 1988) that has gradually changed Australia’s car prices from the world’s dearest to its cheapest
  3. the abolition of indexation of petrol excise in 2001 that has moved Australian fuel prices further down the global list
So the fact is that a “New Deal” in Australia with some serious greenhouse regulation and genuine taxation of highly polluting mineral corporations would rapidly have a major impact on global climate – but the real New Deal did not have the impacts the New York Times claimed during a freakishly harsh winter most probably driven by a highly negative North Atlantic Oscillation.

Sunday, 19 July 2015

100 years since the unique Great Cancer Conjunction

Although I’m one full week late to put it down, this month is 100 years since the “Great Cancer Conjunction” which featured seven planets in Cancer – all except Mars in Gemini, Saturn in Pisces and Uranus in Aquarius. The state of six planets (not necessarily the Moon) in ♋ occurred from 11 to 19 July, when Neptune left ♋, apart form a brief retrograde from 20 March to 1 May 1916, until 4 July 2065.
United States chart for 1915 “Great Cancer Conjunction” at midpoint of seven planets in ♋
It is a unique conjunction for the following reasons:
  1. it is the only case between the seventeenth and twentieth centuries of seven planets in a single water sign
  2. the conjunction includes both Neptune and dwarf planet Pluto in the sign of the conjunction
  3. it is the last occurrence of simultaneous empty fire and empty earth until 26 February 2053
This empty fire and empty earth combination, as it will, allows the naturally conflicting air and water signs to conflict much more strongly than otherwise, especially with the quincunxed planets in Aquarius that at times formed the rare phenomenon of inconjunct stellia during 1914 when Jupiter was in Aquarius.

The traditional ideal of mercy and equality before natural law of the feeling-oriented water signs has consistently conflicted with the ideals of justice and radical equality of result inherent in the psychological type of the air signs. Throughout the Enriched World, this conflict is symbolic of the class conflict played out over the past century and a half – the air signs feel the water signs are unfair, the water signs feel the air signs are uncaring and concerned with only worldly gain.

In the United States chart shown above, Aquarius rising with Uranus and the North Node, and Midheaven in Scorpio, symbolises the “culture wars” at its clearest. Eastern Canada also had ♒ rising, and produced an even deeper philosophical conflict brought to breaking point by the “Green Revolution”and changes in employment suggested by an even fuller sixth house than in the US chart:
Australia, with the conjunction on the Midheaven, becomes the globe’s effective power (contrast with the 1899 Sagittarius conjunction) as its minerals gain a control over not only economy, but also the very climate and ecology of the planet as huge amounts of fossil energy are used to break extremely tight bonds between oxygen and Australia’s superabundant lithophile metals:
Western Australia, with ♌ rising, is much more notable still in its status as a rising power. Vastly too old and infertile for civilised settlement before the discovery of chalcophile fertilisers and lithophile smelting, its extreme flatness and unlimited land supply has turned it, along with its vast resources of unexploited aluminum and titanium ores, into the world’s future superpower. (So much so that I always take charts for future astrological events from Perth). ♌ rising is symbolic of power and autonomy, which Western Australia with its large comparative advantage in agriculture and minerals most definitely has. The Sun in the eleventh house is symbolic of Western Australia as the critical link in the new economy after titanium and zirconium metallurgy was developed in the 1920s.
The Arab Gulf States, with the conjunction on the Ascendant, are rising from poor and completely isolated to become major powers due to their natural resources. With Mercury on the Ascendant, their rulers use this power to spread ideologies that are extremely antiquated (♋) from the perspective of the Enriched World’s native urban populace.
East Asia, with the conjunction in the tenth house, becomes the “mother of business” as it provides (more and more advanced) consumer goods for the rest of the world. ♍ rising in this chart for South Korea symbolises the role of perfection and efficiency in this quest to produce goods for the world, and eastern China would have had ♍ rising over its whole area:
Europe had Gemini rising for the most part with Uranus on the Midheaven (in high latitudes like Scandinavia Cancer would have been rising but Aquarius still on the Midheaven), and this Uranus conjunct Midheaven symbolises the degree of social experimentation governments have found necessary to deal with mass class struggle resulting (in part) from record levels of income inequality during World War I:
Africa, with Taurus rising for the most part, becomes devoted to agriculture as its largely illiterate and poor population and abundant flat land specialised in the least skilled field available. It consequently failed to advance in less practical fields, especially with the conjunction in the second house of Taurus itself.

Saturday, 18 July 2015

The fallacy of forgetting climate history – and of believing averages

During the winter of 2013/2014, after I had told my brother Oklahoma would have “pleasant weather in March, April, October and November”, said that “October was by far the most pleasant month” he had experienced in Norman, and that November was very cold due to the wind.

Today, well over a year later with my brother permanently back in Melbourne and working at Monash, I had a look at the weather in Norman during the period from November 2013 to January 2014 (figures courtesy of the US National Weather Service:
Daily temperature range for Norman, Oklahoma between November 2013 and January 2014
What one can see is that, for the most part, the winter was colder than average. However, no day was nearly as cold as some previous historic cold months in Oklahoma like February 1899, February 1905, January 1930, January 1940, February 1978, January 1979 or December 1983. In these months temperatures reached below 0˚F (-17.8˚C) occurred across the state, with very high wind chills. No doubt those would be dreadful to experience even compared with my 2009/2010 holiday in Japan, Helsinki and the Northeast.
Temperatures (˚C) for January (dark blue), winter (royal blue) and November to March (light blue) in Oklahoma City between 1890/1891 and 1996/1997
Although I cannot gain any ideal of wind chill temperatures, it is nonetheless clear than the winter of 2013/2014 was not unusually cold and that it may be my fault for not realising the effects of wind chill in what I said to my brother about the climate. I then asked my brother about several December days shown in the top diagram which went from -0.6˚C (31˚F) to 20.6˚C (69˚F). Although my brother was travelling around Texas and New Mexico during the period from 17 to 20 December 2013, he said days going from 0˚C to 20˚C were “basically cold”, although to me 20.6˚C is shorts weather unless it is windy. However, I rebutted my brother by saying that Oklahoma city’s hot spell in February 1930 – following a severe cold wave in January – “was not jumper weather”, which can be seen from the graph below:
Oklahoma City temperatures during the winter of 1929/1930. Note the extremely cold weather from 6 January to 2 February and the very warm spell from 5 to 24 February.
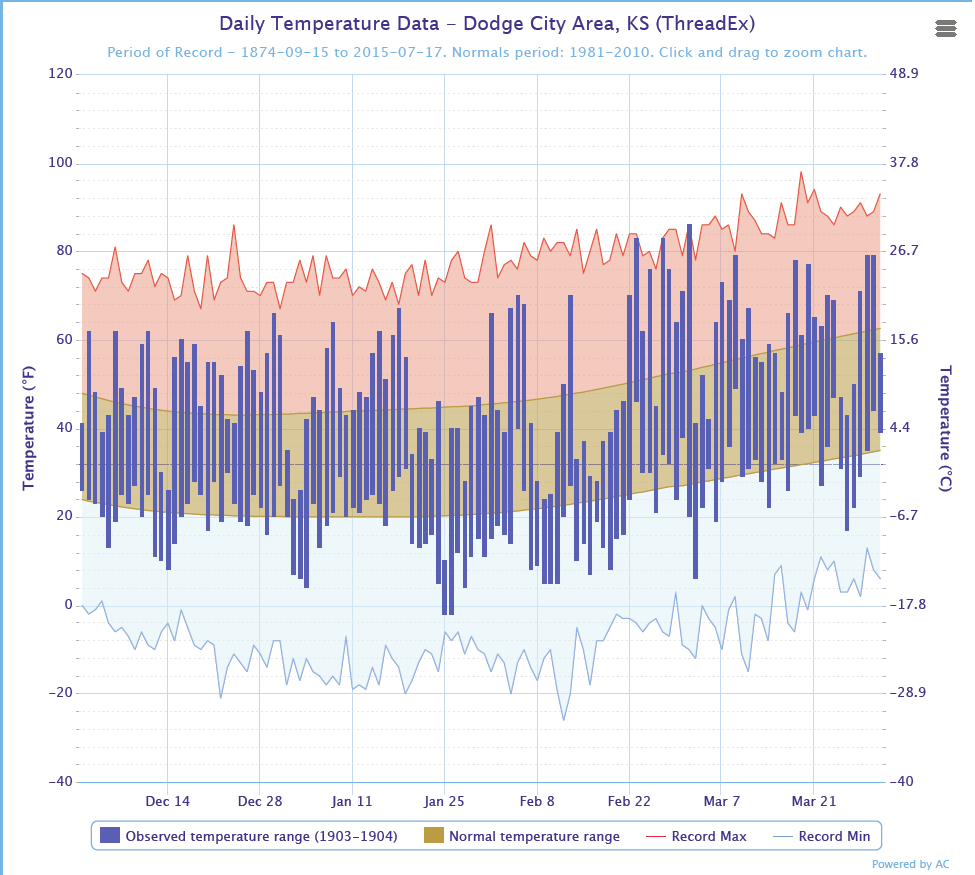
The fact that temperatures in the Great Plains during winter can change dramatically has long been known to me: Havre, Montana in the north of this region has ranged in February from an arctic -49˚C to a warm-enough-for-shorts 24˚C, which must be close to a world record for the largest range of recorded temperatures at a single station during so narrow a range of calendar dates. In February 1962, Scottsbluff, Nebraska ranged from 25˚C to minus 33˚C. In fact, temperatures under the influence of Föhn or “chinook” winds in the region can range within one day by up to 56˚F or 30˚C, as was observed in March 1904 in Dodge City, Kansas:
Daily temperatures from December 1903 to March 1904 in Dodge City, Kansas. Note the extreme diurnal temperature ranges in late February and early March – on one day Dodge City went from 86˚F to 20˚F, both hotter and colder than was reached here in Melbourne in all of March 1904.
These figures taught me something I knew – that people should not ignore past weather as, notably in Western Australia and the Northern Territory, it can owing to the absence of Australian greenhouse emissions be vastly different from present weather. it also taught me something I did not know – that averages and even extremes can be misleading as to how comfortable the weather is. Wet-bulb temperatures in hot, humid climates are a well-known case, but wind-chill and sunshine in cold climates can be a major problem. This is especially true in nations like the US that provide few data on actual wind-speed (though many on wind-chill temperature) and on sunshine.

Tuesday, 14 July 2015

The future for the Enriched World is here

The Greek referendum that has been in the headlines in recent days is a severe warning to the Enriched World. Most commentators – such as Time here – have argued that it stands impossible for Greece to carry out needed funding cuts without losing the trust of their electorate – and they are right.

Experienced economists know that, for a nation without natural resources to build a tax base upon with minimal risk of losing businesses – Greece is geologically much too young to possess deposits of iron, aluminum, titanium or other minerals abundant enough to constitute a long-term resource base – a one-third cut in welfare is totally inadequate to attack government debt. As Hans Hoppe long-ago noted in his Democracy: The God That Failed, public welfare would need to be cut out completely to fully eliminate Greece’s debt. However, returning to the limited government of before universal suffrage would, throughout the Enriched World, definitely produce extreme violence demanding complete seizure of wealth from the business élite. Without the ability to seize Australian resources for the Enriched and Tropical World, this idealised “world communism” would simply not provide prosperity.

The extreme ease of exhaustion of natural inorganic resources in the Enriched World means it is (at all events today) impossible to maintain more than a primitive society without the resources of Australia, Arabia and southern Africa. This is even more true for renewable energy than for fossil fuel-based power: renewable technologies are heavily dependent upon minerals not found in the Enriched World, or found only in very localised regions thereof.

Whilst this business élite has many flaws in its way of life as is noted by insider Andreas Dracopoulos here, it is hardly likely that even if these could be corrected it would be the desired result of equality that the working class has always seen as its ultimate goal. Taxing what Greece’s wealthy ship owners – an industry in which Greece has its only “inherent” comparative advantage owing to numerous islands on the tide-free Mediterranean – earn abroad might be plausible: as much as with Australia’s much vaster and more polluting mineral wealth, if Greece were able to tax its shipping sector it would certainly reduce its losses. However, there are certainly extreme dangers in an economy with such a limited and singular resource base, because there might be switches away from shipping and to much-more-polluting (in terms of requiring extremely energy-intensive metals like titanium) air transport, which would add to the already-vast public losses of the Greek government. It is also possible that if the Greek government taxed what its shipping magnates earn abroad then they would move to bases in foreign nations. Whilst this is not easy because of Greece’s location allowing for more shipping bases than just about anywhere else, it would still be almost certainly easier than for Australian mining magnates who, except with chalcophile elements, almost always live upon the world’s largest reserves of the metals they mine.

The crisis in Greece potentially provides a great lesson for the rest of the Enriched World, which possesses the same comparative disadvantage, debt and unemployment problems as Greece to a lesser degree. If Greece were able to cut taxes and spending by the amount advocated by the Austrian School that its government debt would be reduced, but money wages would fall dramatically and, with the greater bargaining power of employers due to transport improvements, real wages might fall as they did not a century ago in order for each Enriched World nation to be potentially competitive.

Even if real wages did fall across the Enriched World, the benefits from lower prices there would be very large. For one thing, there would be potentially greater diversity in Enriched World economies than tourism and high technology, which have proven hopeless at preventing lowest-low fertility and extreme exclusivity in nations able to support large populations at low ecological cost. Secondly, the Enriched World’s extremely individualistic culture might be ameliorated, and the development of family and community to end lowest-low fertility a possibility. Indeed, in the long-term the Enriched World might be in the long term be less powerless – more able to contain the ecological devastation of resource-rich nations like Australia, South Africa and the oil states with their greenhouse pollution and unsustainable agriculture – with lower wages and prices, because it would not be burdened with funding a selfish class without resources to do so.